
Commodity markets that for decades regarded some materials as secondary commodities are seeing their demand profile change as a result of the energy transition. Silver is one such commodity. While gold gets all the headlines when it comes to precious metals coverage, silver’s industrial profile has been quietly reshaping in part due to what’s happening on utility-scale solar farms, residential rooftops, and the supply chains that link them. In this article, we will discuss why that relationship has turned into a structural aspect in the long-term price formation of silver.
Silver’s Industrial Role and Why Solar Has Shifted the Conversation
To grasp the reasons for solar energy’s importance as a material driver for silver prices, it is necessary to have some sense of what silver does outside of the jewelry industry and central bank vaults. For anyone watching the silver price today, the biggest picture isn’t just the dollar value on a trading screen but rather the demand structure that has been subtly but significantly changing itself as the world’s clean energy money begins to rapidly flow.
Silver has a wider range of uses in industry than people think. A few of the more important applications are:
- Electrical contacts and conductors. Silver’s conductivity is greater than copper’s, so it is difficult to replace in applications that are high precision.
- Photovoltaic cell manufacturing. Crystalline silicon solar cells are made with conductive contacts that are formed out of a silver paste.
- Automotive/EV systems. Silver is used in various electronic components, such as switches, sensors, and electrical contacts, across the board in vehicle electronics.
- Medical and antimicrobial materials. Surface, filtration and wound care applications use silver-infused coatings.
It’s where the pricing story becomes significant as solar has climbed to one of the most demanding of these applications in volume terms.

Why Crystalline Silicon Cells Still Dominate
Most solar panels worldwide are based on crystalline silicon technology. In these cells, “silver paste” is screen printed on the front and back to form electrical contacts to conduct current out of the cell. If not, then no output can be used. Silver isn’t a secondary component that can be cut off – it has a function directly related to cell performance.
The relevance to the demand forecast is that there’s no imminent displacement of crystalline silicon. There are commercial quantities of thin-film alternatives, such as cadmium telluride or CIGS, but they don’t employ silver in the same way. The worldwide solar manufacturing infrastructure is still based on the silver architecture.
The Challenge of Finding a Workable Substitute
Copper has been investigated as a front-side contact material, and the development of such a front side has been achieved at a laboratory scale. But, under solar panel operating conditions (moisture and heat), copper corrodes quickly. So far, this involves protection layers that are not necessary and extra process steps that manufacturers are not prepared to tolerate at a commercial scale, at present. There is still no front-side copper replacement on the large scale, and the realistic timing is still unclear.
Scale of Solar Deployment and Silver Demand Implications
However, if silver’s contribution to a solar cell remained the same and volumes of installations remained small, it wouldn’t be a commodity story. What is making it one is the rate of deployment of the sun in the last four to five years and the nature of the demand that has been created.
Record Capacity Additions and What They Signal
The global PV market has set a new record for installations each year from 2024 to 2025, totaling more than 600 GW annually.
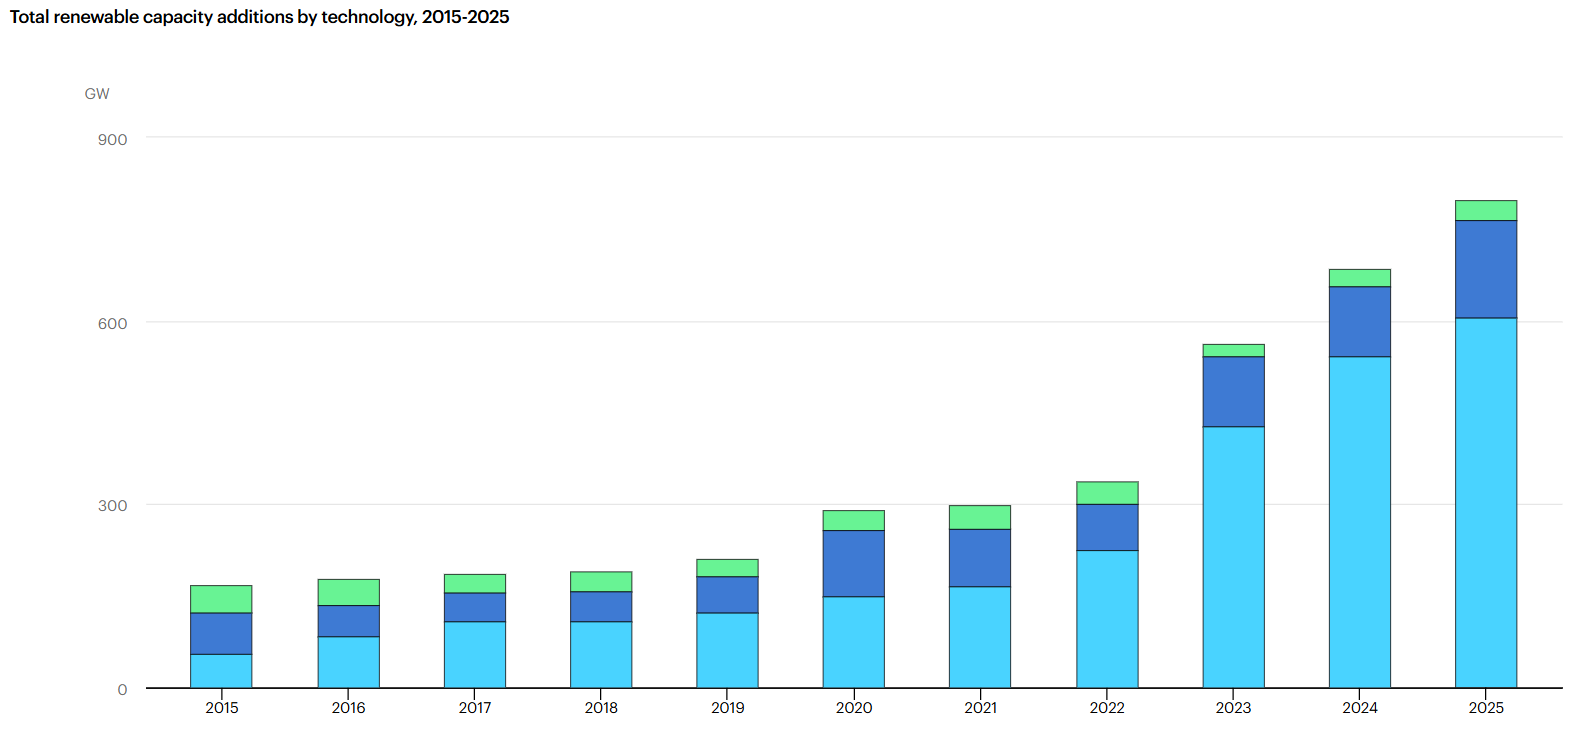
Solar PV had the fastest growth rate of any energy source globally, growing by more than all other energy sources combined. But the countries involved aren’t only the first movers, China, India, the United States, Brazil and several EU member states are running massive deployment programs at the same time.
This is not a one-time demand spike. It is a sign of policy intent, a decreasing levelized cost of solar power and corporate renewable energy procurement targets, and it suggests continued long-term deployment, not a cyclical recovery.
What Deployment Volume Actually Means for Silver
World Silver Survey 2026 by The Silver Institute projects that AI infrastructure and data centers are the main drivers of growth in industrial silver demand, resulting in the physical market’s sixth consecutive yearly shortfall.
Despite the fact that manufacturers have been trying to decrease the amount of silver per cell (also known as “thrifting”), the in absolute number of usage of silver by the solar industry has continuously increased due to the large amount of capacity in production.
A helpful way to think about this: If there is a 10% cut in silver used per cell, but double the number of cells installed, the total amount of silver consumed is still about 80% more. The math of scale always outstrips the math of efficiency.
The Byproduct Problem: Why Silver Supply Isn’t Elastic
Unlike copper or lithium, in the case of silver, an increase in the price does not necessarily increase the incentive of primary miners to increase their production. About 70-75% of the world’s silver production is as a byproduct of the mining of other metals, mainly lead, zinc, copper and gold. The decision to expand a lead-zinc operation is not made based on silver prices, but rather on the economics of those metals.
This implies that when demand for silver goes up, the supply of silver can not increase at the same time:
- The primary silver deposits are a small part of the production capacity worldwide.
- Volumes of byproduct silver depend on the market conditions for the host metal.
- New mine development cycles are typically 5-15 years of time to go from exploration to production.
- Allowing, financing, and building schedules further delay supply responses
- Changes in the markets for lead, zinc, or copper can affect silver byproduct volumes irrespective of the level of the silver price.
Mining Investment Cycles and Their Lag Effects
Even if a primary silver deposit can be identified and capital is being invested in developing it, it will still take a number of years from the investment decision to first production. Permits, community engagement requirements and construction stages all factor into delays, which make the ability to respond to demand growth quickly challenging. This structural lag magnifies the impact on the market of the speedy-moving demand drivers, such as solar deployment.
Cell Technology Evolution and Its Mixed Impact on Silver Consumption
Silver costs haven’t been a silent issue in the solar manufacturing industry. There has been a persistent push to achieve lower silver intensity per watt of capacity and concrete progress has been made, albeit sometimes in a more nuanced manner than is sometimes portrayed in the headline news.
PERC, TOPCon, and HJT: A Comparison
There are three cell architectures that are commercially significant and under production, each with meaningfully different silver consumption profiles:
| Cell Technology | Silver Intensity | Efficiency Range | Commercial Status |
| PERC | Lower (thrifting well-advanced) | ~21-22% | Widely deployed, maturing |
| TOPCon | Medium | ~23-24% | Rapidly scaling globally |
| HJT | Higher (electrodes on both sides) | ~24-26% | Growing, premium applications |
HJT cells need silver-coated electrodes on the front and back of the cell and have a higher efficiency and lower long-term degradation rates. Incorporating straightforward thrifting projections will actually undercount the industry-average silver content per cell if there is an increase in HJT adoption in premium commercial and utility applications.
Why Efficiency Gains Don’t Automatically Reduce Total Demand
Manufacturers have made real strides to reduce the amount of silver paste from 400-500 milligrams per cell 10 years ago to less than 100 milligrams per cell in today’s PERC designs. However, there are physical floors below, which have silver contacts that lose the conductivity required for cell efficiency. The switch from a conventional SENTO to TOPCon and HJT started following a similar trend to Jevons’ paradox, where the silver consumption increased due to a lot more units being produced with a small efficiency gain per unit. But now, a sharp 2026 cost-cutting has disrupted this trend and per-unit thrifting finally outstripped volume growth, resulting in a 19% total decline in solar’s silver demand.
ESG Investors and the Silver-Solar Connection: How They Read Each Other
Silver’s increasing presence in renewable energy infrastructure adds a layer of complication to the analysis for ESG investors. One side is that silver will be used in solar panels, which directly is in line with decarbonization goals. At the opposite end of the spectrum, however, environmental and governance issues do not vanish when the use of the silver downstream is described as “green.
The production of silver is geographically concentrated, with important production from Mexico, Peru, China, Bolivia and Russia. These each have unique risk profiles:
Mexico is the world’s largest producer of silver and silver production is sometimes subject to regulatory and tax changes that impact the mining industry.
In Peru, there has been a historical pattern of community disputes related to land and water rights in the context of mining.
China contributes a significant share of silver production as well as silver-paste manufacturing, creating supply chain transparency issues for investors who have robust screens for provenance and governance.
The big takeaway here is that the ESG due diligence process for silver shouldn’t end with its end-use application. The supply chain of materials for the energy transition needs to be analyzed in the same way as any other industrial supply chain. However, investors who think silver is necessarily “ESG-aligned” because it’s used to make solar panels are using an incomplete framework.
What Remains Uncertain and What Could Shift the Trend
There is some warranted skepticism about structural commodity arguments. There’s a solid argument for the solar-silver demand side, but there’s a potential disruptor. There are some factors that could significantly affect the course over the next five to ten years:
- Commercial-scale copper metallization. There is ongoing investment in R&D for copper-based front contacts at a number of research institutes but a scalable solution with yield stability would have a real impact on reducing the silver per cell.
- Advanced deposition techniques. New printing techniques being developed, such as nano-silver inks, may make it possible for volumes of paste to be reduced even more than has been done with current thrifting methods.
- Concentrated supply geography. Global silver supply is heavily concentrated in a handful of nations and operational or geopolitical events can result in short-term price swings that are unconnected to demand fundamentals.
- Changes in technology mix due to policy. Government procurement programs or feed-in structures may change the market’s technology mix if they start to prefer cell architectures that require less silver.
These factors are not to discredit the structural demand argument for silver, but do indicate that linear extension of the current trends is fraught with actual risk. None of these factors affects silver prices independently, as monetary policy, currency, investment, and industrial demand all have an effect on silver prices at the same time.
Where the Silver-Solar Relationship Stands in Mid-2026
A few years ago, it would have seemed like a specialist commodity desk thing to note that solar is driving silver as a structure. It’s now included in materiality assessments in ESG and in longer-term projections of industrial demand because the numbers are big enough to count in the market. The combination of an inelastic supply side and an application that has proved to be substitution resistant, coupled with the accelerating deployment of solar power, presents an opportunity that is worth analyzing.
It is not a simple relationship and one not entirely independent of wider economic forces. However, it can be measured, is now increasingly well-documented and is becoming a more important strategic consideration for green technology stakeholders, for investors with environmental, social and governance (ESG) mandates and for those who follow commodity fundamentals and have a long-term time horizon.
Disclaimer
This article has been written as a source of information and education. The material in this article should not be construed as a financial, investment, buy, hold or sell recommendation of any security, commodity, or financial instrument. The commodity markets are volatile, and there are a wide range of macroeconomic, geopolitical and structural factors impacting the markets not discussed in this article. Historical performance of any asset or market is not necessarily a good predictor of future performance. ESG frameworks, methodologies, and definitions are unique to each institution and continually evolving. Investors are reminded to do their own independent investigation and should always talk to a competent financial adviser before making any investment decision or trade.
 Mirelith Norcroft is the kind of writer who genuinely cannot publish something without checking it twice. Maybe three times. They came to financial planning resources through years of hands-on work rather than theory, which means the things they writes about — Financial Planning Resources, Expert Analysis, Investment Strategies and Insights, among other areas — are things they has actually tested, questioned, and revised opinions on more than once.
That shows in the work. Mirelith's pieces tend to go a level deeper than most. Not in a way that becomes unreadable, but in a way that makes you realize you'd been missing something important. They has a habit of finding the detail that everybody else glosses over and making it the center of the story — which sounds simple, but takes a rare combination of curiosity and patience to pull off consistently. The writing never feels rushed. It feels like someone who sat with the subject long enough to actually understand it.
Outside of specific topics, what Mirelith cares about most is whether the reader walks away with something useful. Not impressed. Not entertained. Useful. That's a harder bar to clear than it sounds, and they clears it more often than not — which is why readers tend to remember Mirelith's articles long after they've forgotten the headline.
Mirelith Norcroft is the kind of writer who genuinely cannot publish something without checking it twice. Maybe three times. They came to financial planning resources through years of hands-on work rather than theory, which means the things they writes about — Financial Planning Resources, Expert Analysis, Investment Strategies and Insights, among other areas — are things they has actually tested, questioned, and revised opinions on more than once.
That shows in the work. Mirelith's pieces tend to go a level deeper than most. Not in a way that becomes unreadable, but in a way that makes you realize you'd been missing something important. They has a habit of finding the detail that everybody else glosses over and making it the center of the story — which sounds simple, but takes a rare combination of curiosity and patience to pull off consistently. The writing never feels rushed. It feels like someone who sat with the subject long enough to actually understand it.
Outside of specific topics, what Mirelith cares about most is whether the reader walks away with something useful. Not impressed. Not entertained. Useful. That's a harder bar to clear than it sounds, and they clears it more often than not — which is why readers tend to remember Mirelith's articles long after they've forgotten the headline.